Historical Contribution of Different
Sources to Environmental Dioxin Pollution Estimated from the Lake Shinji
Sediment Core
(PDFファイルはここをクリック。PDFfile
is here.)
Shigeki Masunaga1, 2, Yuan Yao1, 2,
Isamu Ogura1, Satoshi Nakai1, Yutaka Kanai3,
Masumi Yamamuro3, and Junko Nakanishi1,
2
1 Institute of Environmental Science and Technology,
Yokohama National University
79-7 Tokiwadai, Hodogaya-ku, Yokohama, 240-8501,
Japan
2 CREST, Japan Science and Technology Corporation
Kawaguchi, Kawaguchi 332-0012, Japan
3 Geological Survey of Japan, 1-1-3 Higashi, Tsukuba
305-8567, Japan
Introduction
A significant portion of dioxins accumulated in surface
aquatic sediment in Japan was indicated to have originated from agrochemicals,
especially pentachlorophenol (PCP) and chloronitrofen (CNP)(1). Since these
chemicals were used extensively as paddy field herbicides in the past,
their present contribution to pollution may be less than that in the past.
Thus, it is of interest to estimate their historical contribution to environmental
dioxin pollution. In this study, we analyzed dioxins in a dated sediment
core taken from Lake Shinji which receives effluent from agricultural land
and some local towns. A total of more than 80 gas chromatographic peaks
corresponding to individual congeners or groups of congeners were quantified
in order to perform a detailed statistical analysis.
Materials and Methods
Sediment core: A sediment core sample
was taken from the western part of Lake Shinji, Shimane Prefecture, in
1994. The core was sliced into 1-cm-thick disks, and the average sedimentation
rates were estimated to be 0.26 g/cm2/year by the Pb-210 method and 0.25
g/cm2/year by the Cs-137 method(2). Both estimates were similar and the
value obtained using the Pb method was used in this study.
Dioxin analysis: After the addition
of 13C-labeled internal standards, dried sediment disks (about 4 g) were
Soxhlet-extracted with toluene for 20 hours. They then were treated by
alkaline hydrolysis and concentrated sulfuric acid. They were further cleaned
using a series of silica gel, aluminum and carbon columns. The final PCDD/F
and coplanar PCB fractions were concentrated to 25 m
l and spiked with 13C-labeled recovery standards for HRGC/HRMS analysis.
Both DB-5 and DB-17 columns (J&W Scientific) were used for quantification.
Results
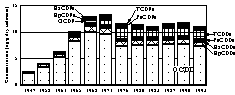
Dioxins in the sediment core: More than
80 gas chromatographic peaks corresponding to the individual tetra- through
octa-chlorinated PCDD/F congeners or groups of congeners were quantified
using the DB-5 column. All the 2378-chlorine-substituted congeners were
quantified using both DB-5 and DB-17 columns. Some of the results are shown
in Table 1.
Table 1. Dioxin concentrations in Lake Shinji sediment
core
(pg/g dry sediment or pg TEQ/g dry sediment)
* Calculated using the I-TEFs (WHO/ICPS, 1988). ** Calculated
using the TEFs for human (WHO, 1998)
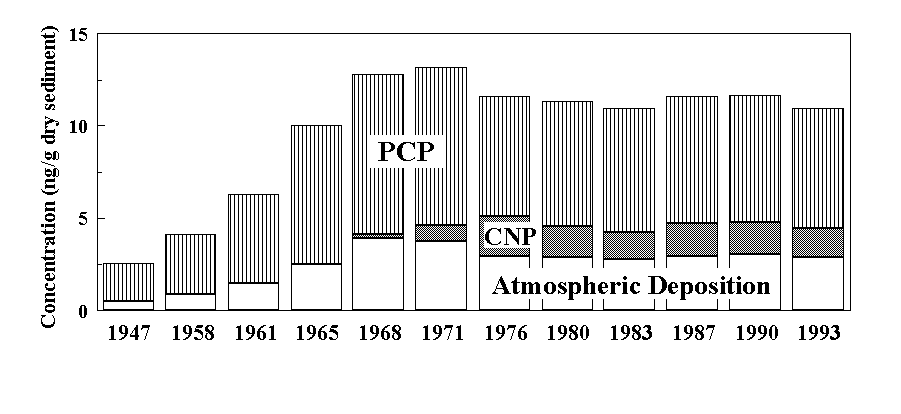
A drastic increase in the total PCDD/F concentration in
sediment occurred during 1945-1970 followed by a small decrease during
1972-1994 (Figure 1). The major components that increased during 1945-1970
were OCDD and HpCDD congeners, which are known impurities of PCP(3).
They decreased during 1972-1976 but have remained at the same level since
1980. The period between 1972 and 1976 corresponds well to the period during
which PCP use declined rapidly in Japan (1970-1972). In contrast to the
highly chlorinated dioxins, TCDDs, PeCDDs and TCDFs (especially 1368-TCDD,
1379-TCDD, 12368-PeCDD, 12379-PeCDD and 2468-TCDF) increased during 1964-1977
but have since remained at the same level. These congeners are reported
to be the major impurities of CNP(3). The period from 1964 to
1977 corresponds well with the period from 1966 to 1972 during which the
use of CNP in Japan increased rapidly.
(クリックすると大きくなります)
Figure 1. Dioxin concentration in dated Lake Shinji
sediment core.
Principal component analysis: To identify the
possible sources of dioxin in the sediment, principal component analysis
was performed using a correlation matrix calculated from congener-specific
data (83 GC peaks as variables and 12 slices of sediment core as cases).
Analysis after the varimax rotation yielded three major principal components
(PCs) (Table 2). Based on the characteristic congeners in each PC, PC-1
and PC-2 were judged to be impurities of PCP and CNP, respectively. It
was not possible to attribute PC-3 to any known sources confidently; however,
PC-3 might correspond to another major dioxin generator, incineration.
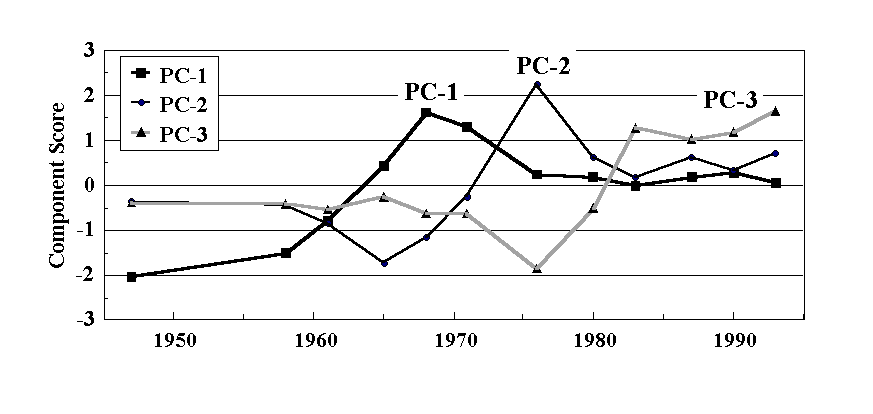
The principal component scores of all PCs are shown in Figure 2. The component
score of PC-1 increased during the 1960s and reached its maximum in around
1970. The component score of PC-2 follows the same trend as that of PC-1
but with a delay of several years. The behaviors of PC-1 and PC-2 were
in accordance with the amounts of PCP and CNP used in Japan, respectively.
Table 2. Results of principal component analysis
with varimax rotation
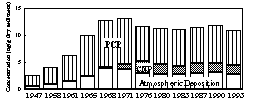
Estimated trends of different dioxin source contributions:
Based on the result of PC analysis, we assumed that PCP, CNP and incineration
(atmospheric deposition) are the three major sources of dioxin in Lake
Shinji. Their contributions to pollution in sediment were estimated by
multiple regression analysis using congener profiles of dioxin impurities
in PCP(3) and CNP(3) and of
(クリックすると大きくなります)
Figure 2. Component scores of three principal components
(PCs)
atmospheric dioxin deposition. For atmospheric deposition,
data obtained in the Kanto area(4) were used because of the
lack of congener-specific data in this area. The result indicated that
PCP had been the greatest contributor to aquatic sediment pollution since
the 1950s (Figure 3). The contribution from CNP began in the 1970s. Atmospheric
deposition increased during the 1950s and 1960s and subsequently leveled
off.
(クリックすると大きくなります)
Figure 3. Contributions of different sources to dioxin
pollution in sediment core
Discussion and Conclusion
Detailed analysis of a dated sediment core showed that
dioxin input to aquatic sediment increased in accordance with PCP and CNP
use. The input did not significantly decrease even after the decline of
their use, indicating that dioxins remaining in agricultural land continued
to run off and pollute the aquatic environment. A discrepancy between the
contributions of different sources presented here and those estimated from
the dioxin source inventory(5) was noted. This may be due partly
to the limitation of the present statistical analysis based on data consisting
of a very wide range of concentrations (very high concentration of OCDD
and low concentration of many other congeners).
Acknowledgements: This work has been supported by Core
Research for Evolutional Science and Technology (CREST) of the Japan Science
and Technology Corporation (JST).
Reference
1) Masunaga, S., Sakurai, T., Ogura, I., Nakanishi,
J.: Organohalogen Compounds 1998, 39, 81-84.
2) Kanai, Y., Inouchi, Y., Yamamuro, M., Tokuoka, T.:
Chikyukagaku
(Geochemistry) 1998, 32, 71-85.
3) Masunaga, S., Nakanishi, J.: to be presented at Dioxin'99
in Venice, Italy, Sept. 1999.
4) Ogura, I., Masunaga, S., Nakanishi, J.: to be presented
at Dioxin'99 in Venice, Italy, Sept. 1999.
5) Masunaga, S.: Proc. of 2nd International Workshop
on Risk Evaluation and Management of Chemicals, in Yokohama, Japan,
Jan. 1999.